Software Operation Basics
There are six operational steps used to run the Gravity Lab user interface. These steps are summarized below with minimal detail for quick software use.
FIND LAB
Find Lab

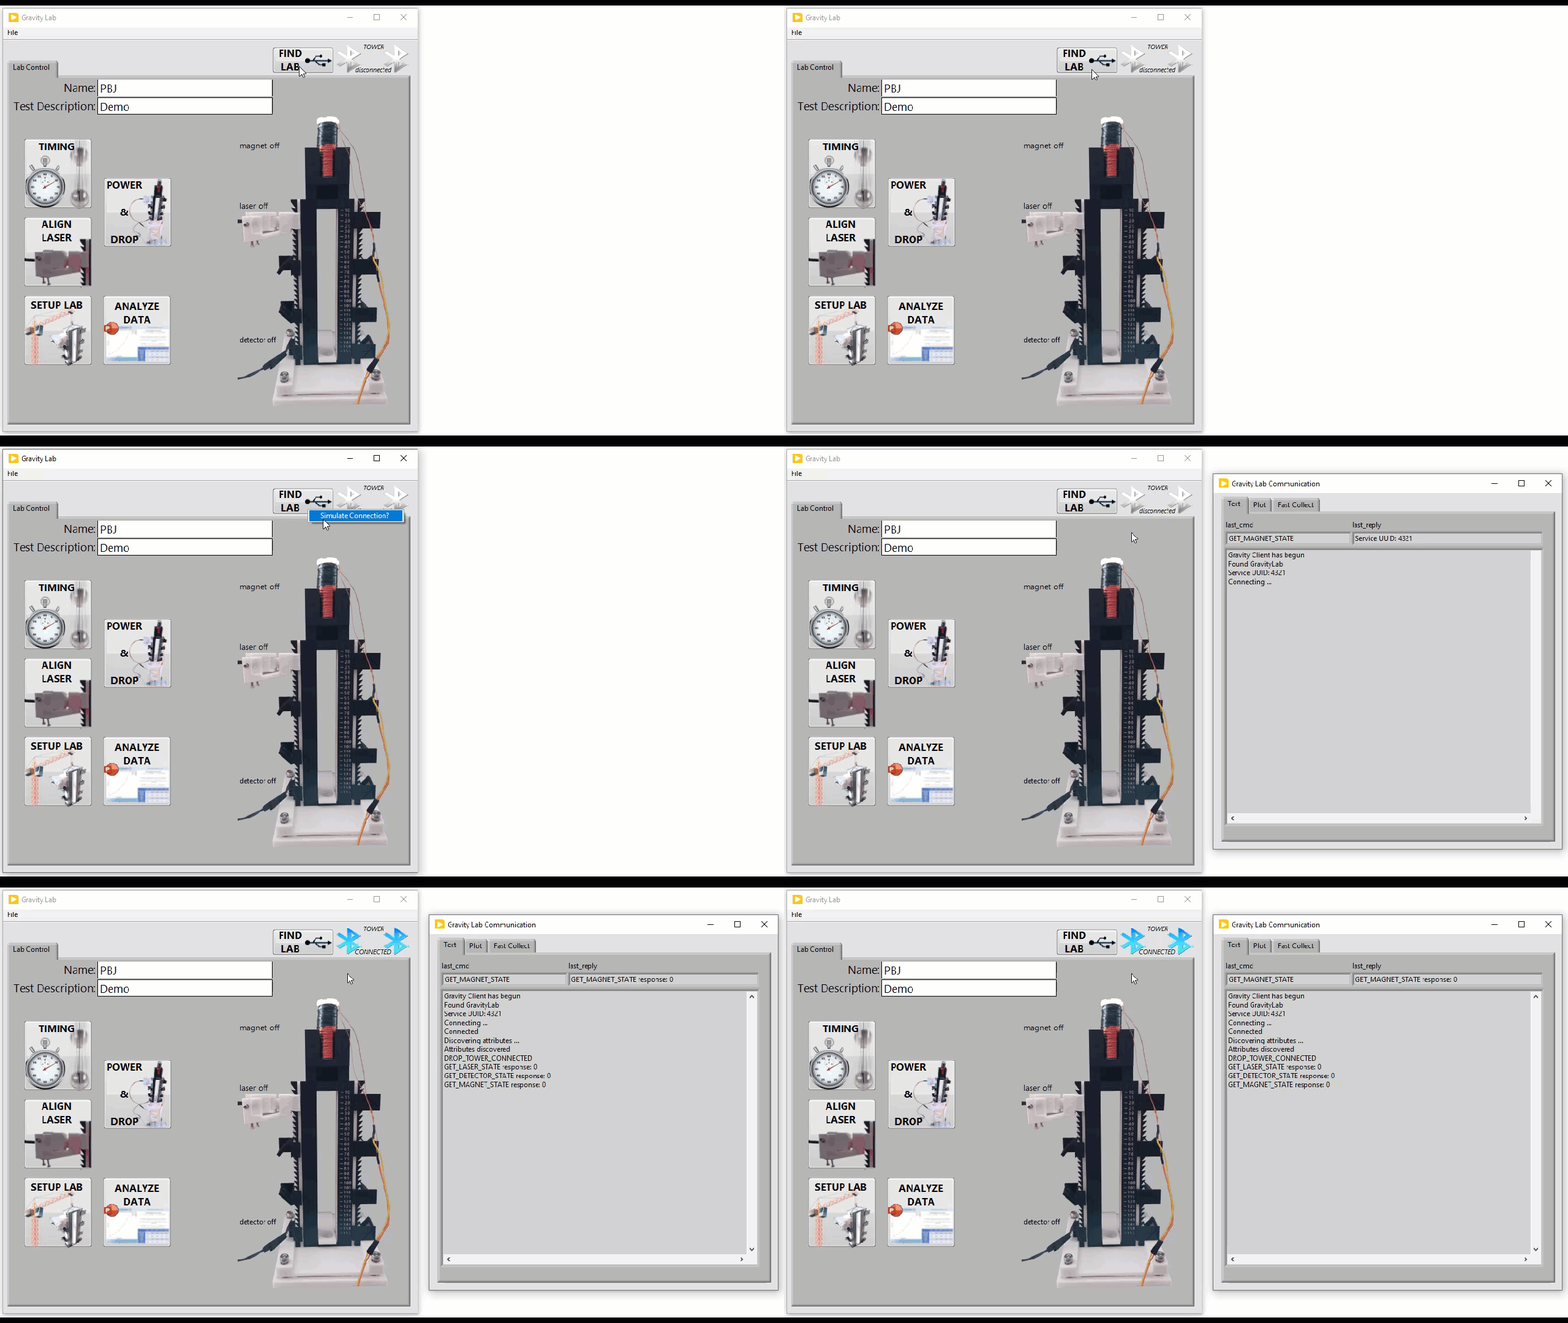
Push the “Find Lab” button after you have connected and powered on the drop tower hardware.

If you do not have any hardware, the drop tower connection can be simulated by right clicking on the find lab button and selecting Simulate Connection?
Data saved in this mode will have “SIMULATE” prepended to the filename.
The “Gravity Lab Communication” widow will open, the bluetooth indicator go from Tower Disconnect to Tower Connected and the raw text communication will be shown as the computer talks over bluetooth low energy to the drop tower.


SETUP LAB
Setup Lab
Push the “SETUP LAB” button and the “Setup Lab” window will open.
Enter your Latitude in degrees(°) and Altitude in feet(ft) on the Test Location tab. If you hover over these controls you will see their values in radians(rad) and meters(m)


On the Beam Positions tab the Steel Ball top position and Beam positions are entered in millimeters(mm). The right click options on this control were added for quick restoration of previously used values.


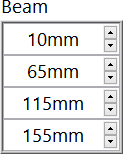

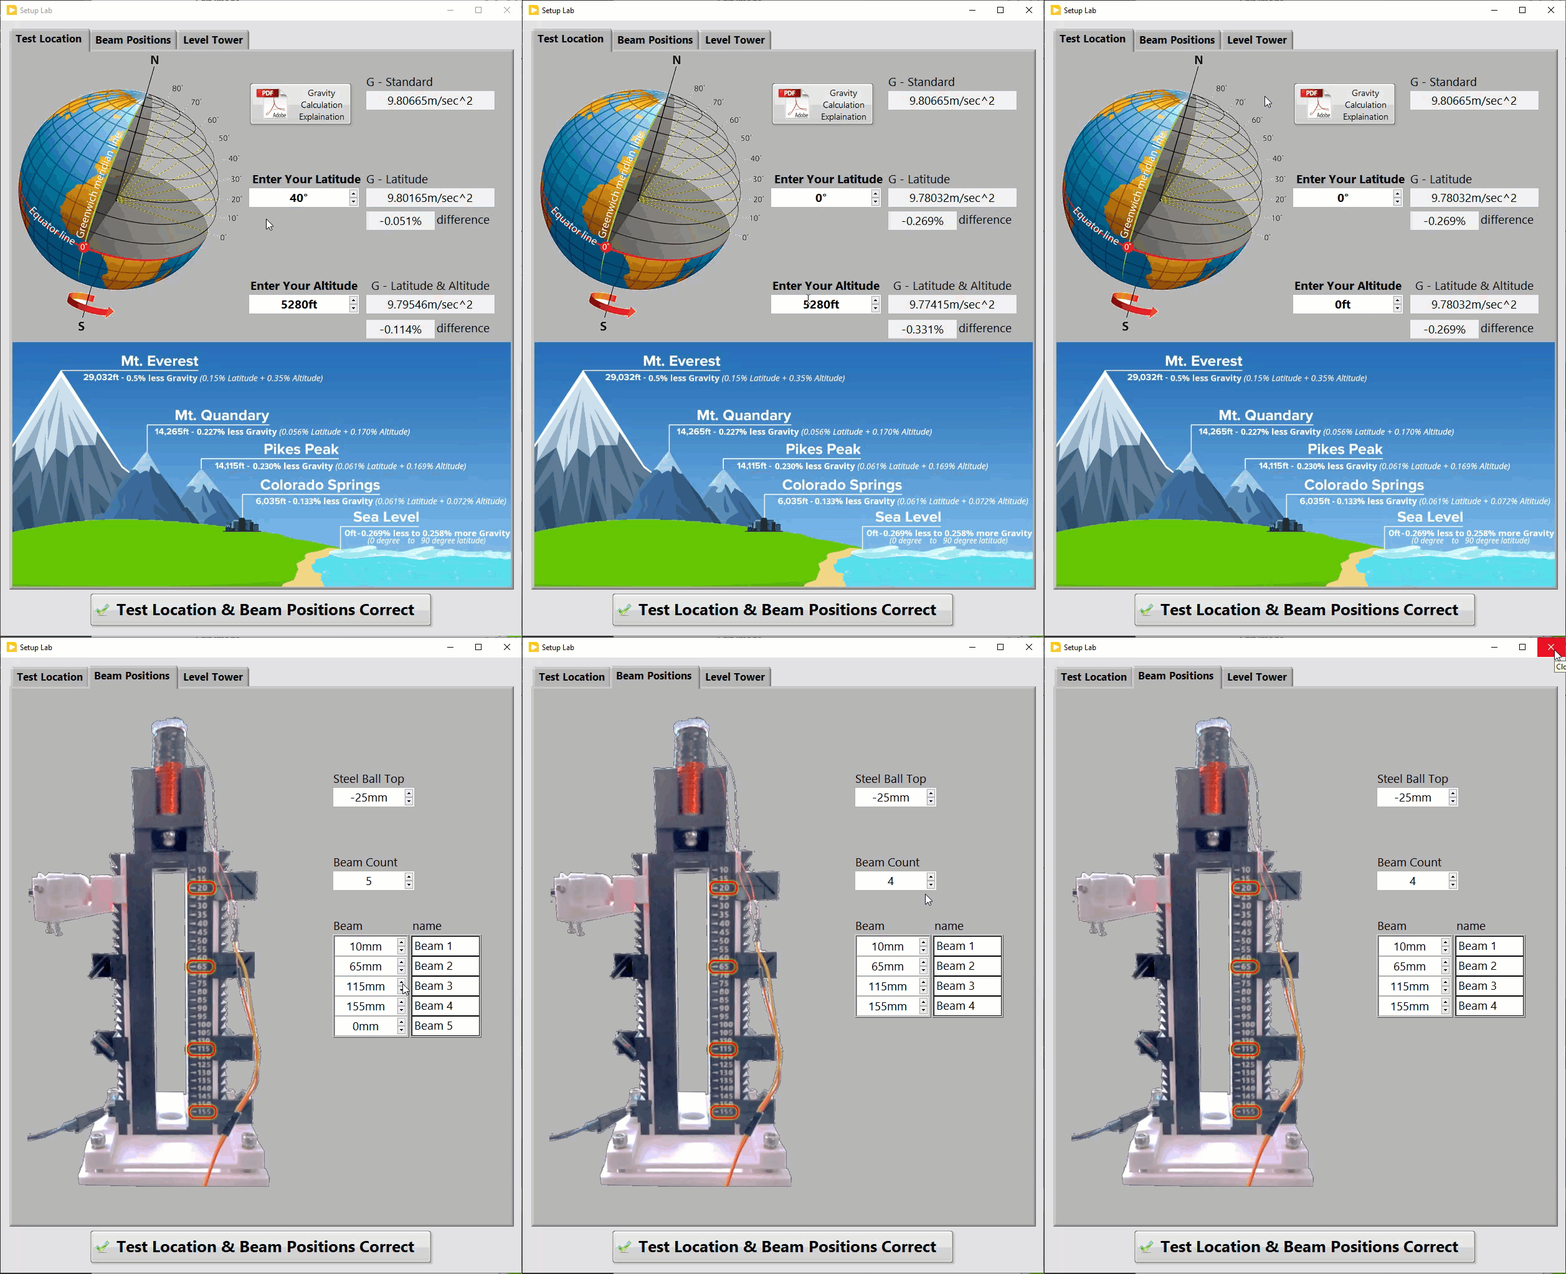
Close the window or push the button named “Test Location & Beam Positions Correct”.
Your settings will be saved and used for future operation of this software.
Align Laser
Align Laser
Push the “ALIGN LASER” button to turn on the laser and detector and display the current Detector Signal as a Digital Number (DN) on a running plot in the “Align Laser” window.
Now you can align the laser through the Tower and watch the detector value change.
First, use a piece of paper to get a signal on the detector.
Next, peak up the signal from 400DN to 800DN for 4 beams.
Measurement saturation must be avoided, but is not an issue in the current setup of 4 beams with the voltage divider used.
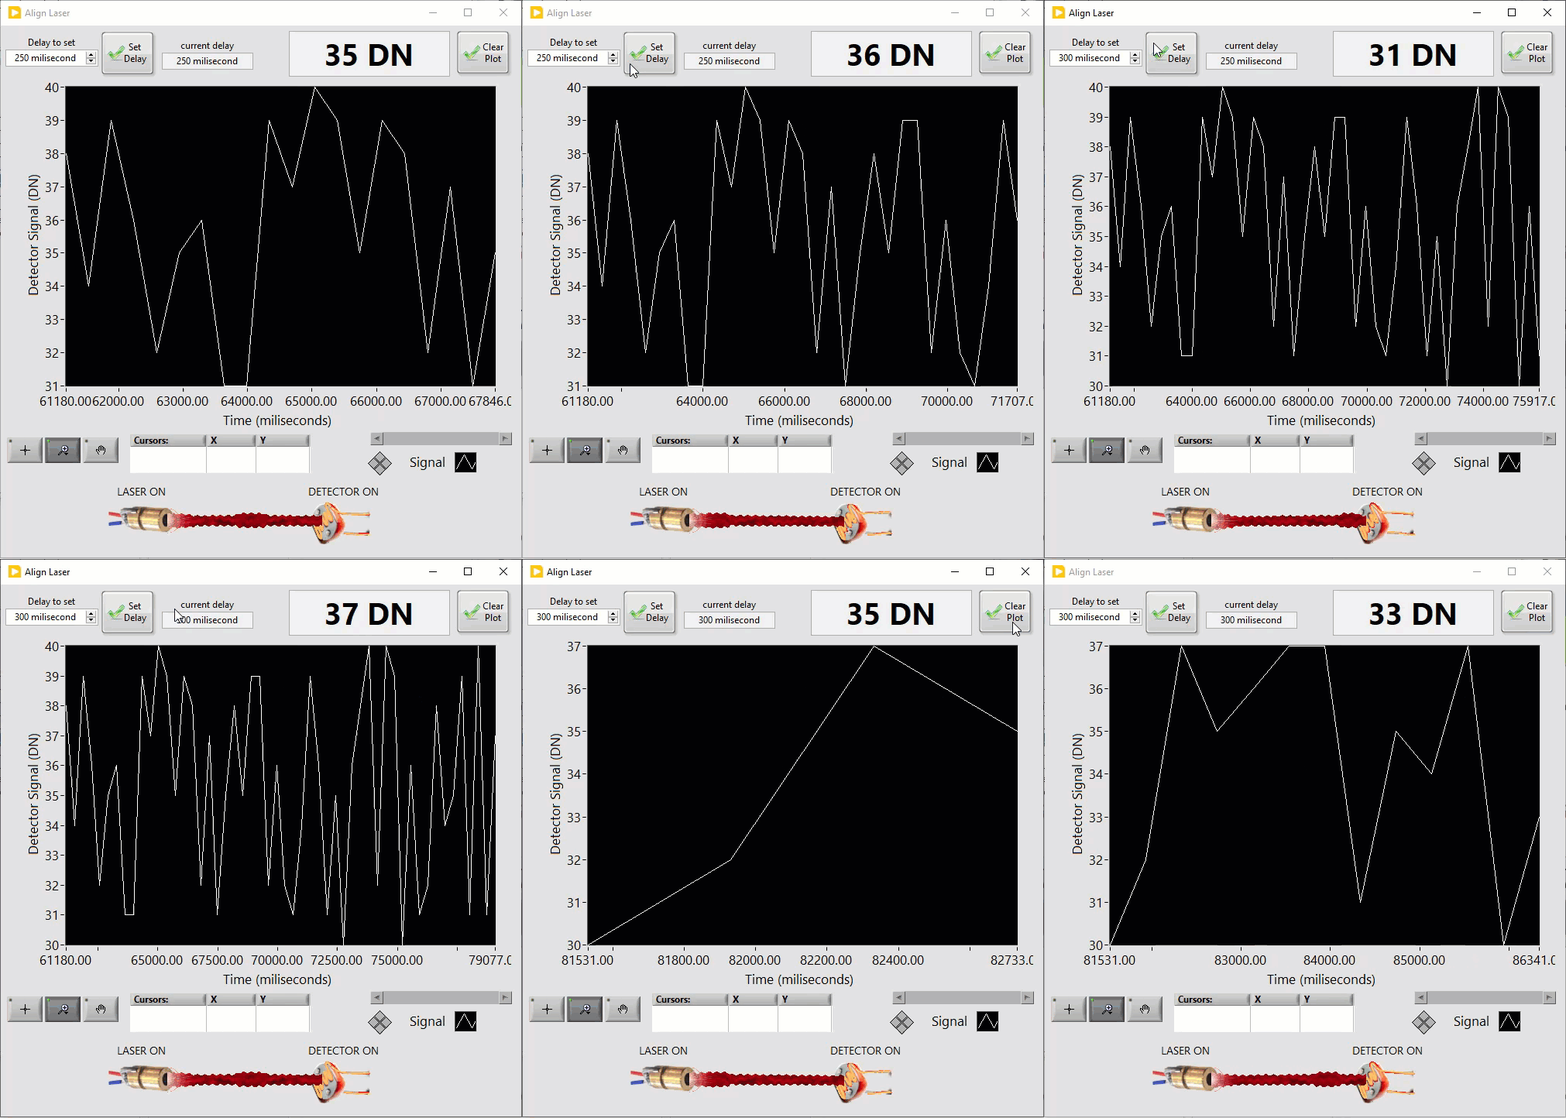


Change the speed of the signal being displayed by entering in a new value to the “delay to set” control and pushing the “Set Delay” button.

Clear the plot by pushing the “Clear Plot” button.
When you are satisfied with the current alignment, close the “Align Laser” window to enable the “TIMING” and “POWER & DROP” Buttons.
Timing
Timing
Push the “TIMING” button to configure the data collection for the drop tower. These values are loaded from the configuration file, and are sent to the drop tower after the “Push To use This Configuration button” is pushed or this window is closed.
The graph shown displays the beam positions and the expected data points to be collected from the current configuration defined by 3 controls. The circles drawn represent the ball positions at the top of the tower, and the start and end of the data collection.
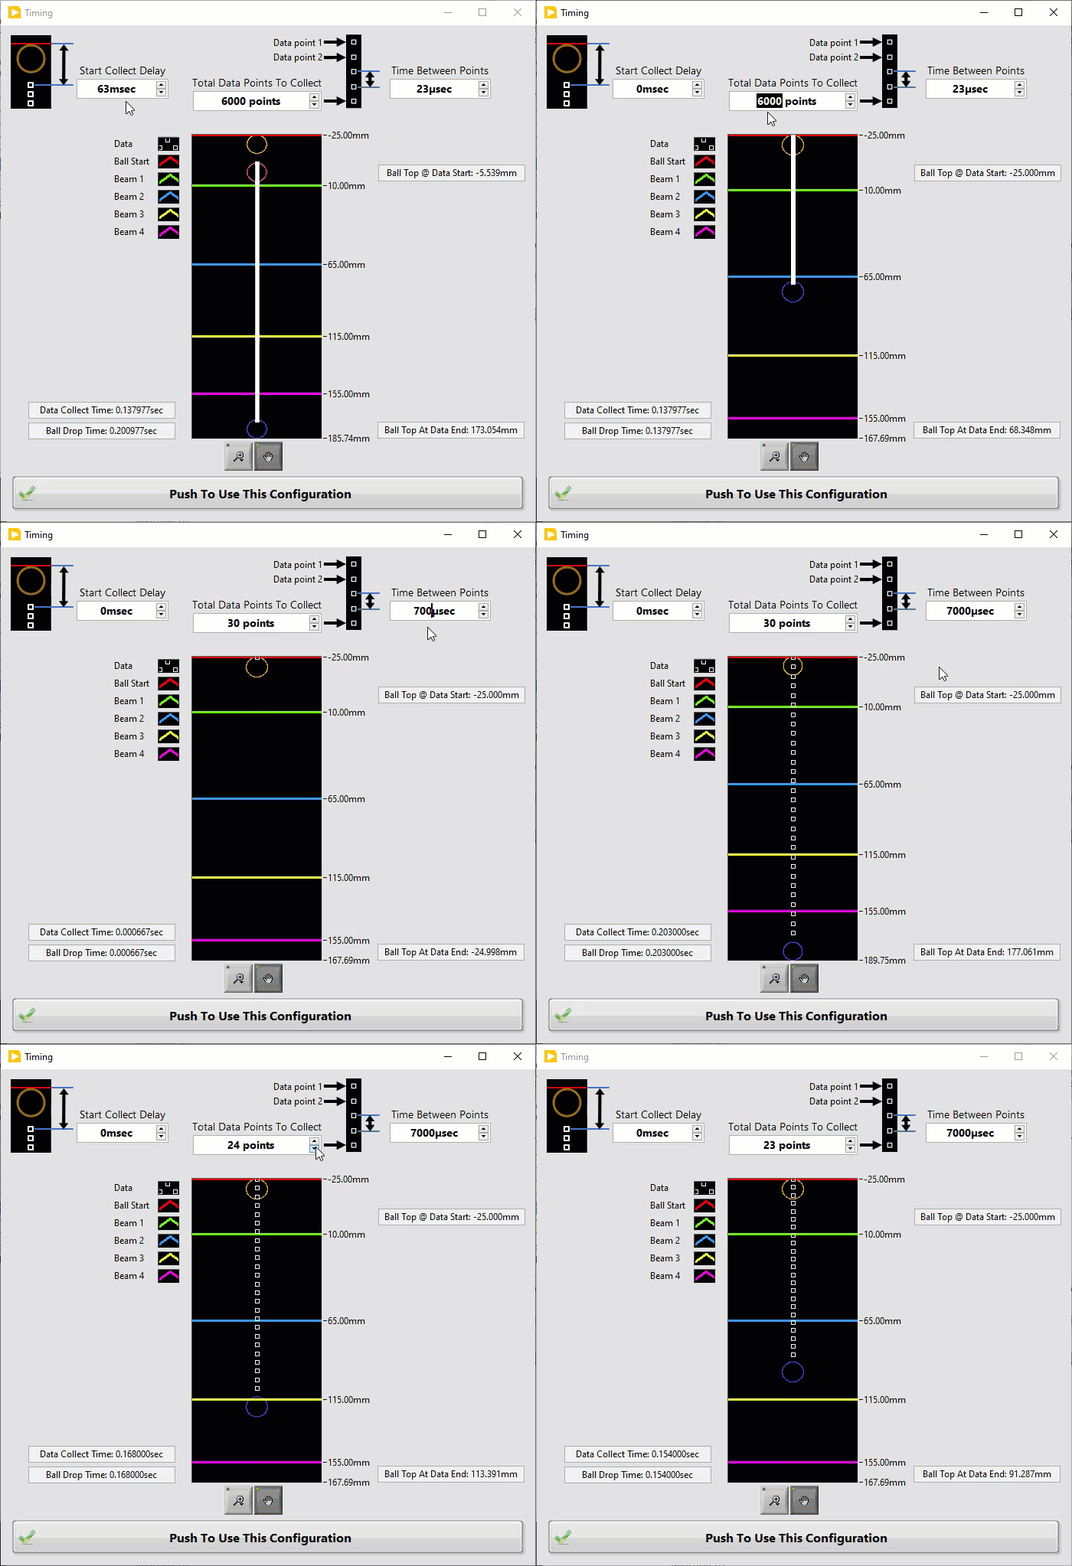

The “Start Collect Delay” control determines when the first data point from the detector is collected after the ball is dropped

The “Total Data Points To Collect” control defines how many points are collected from the detector after the ball is dropped.
Power & Drop
Power & Drop
Push the “Power & Drop” button to power on the Magnet. When everything is powered on you will be instructed to “Insert Steel Ball Then Push Button or Press Enter”.
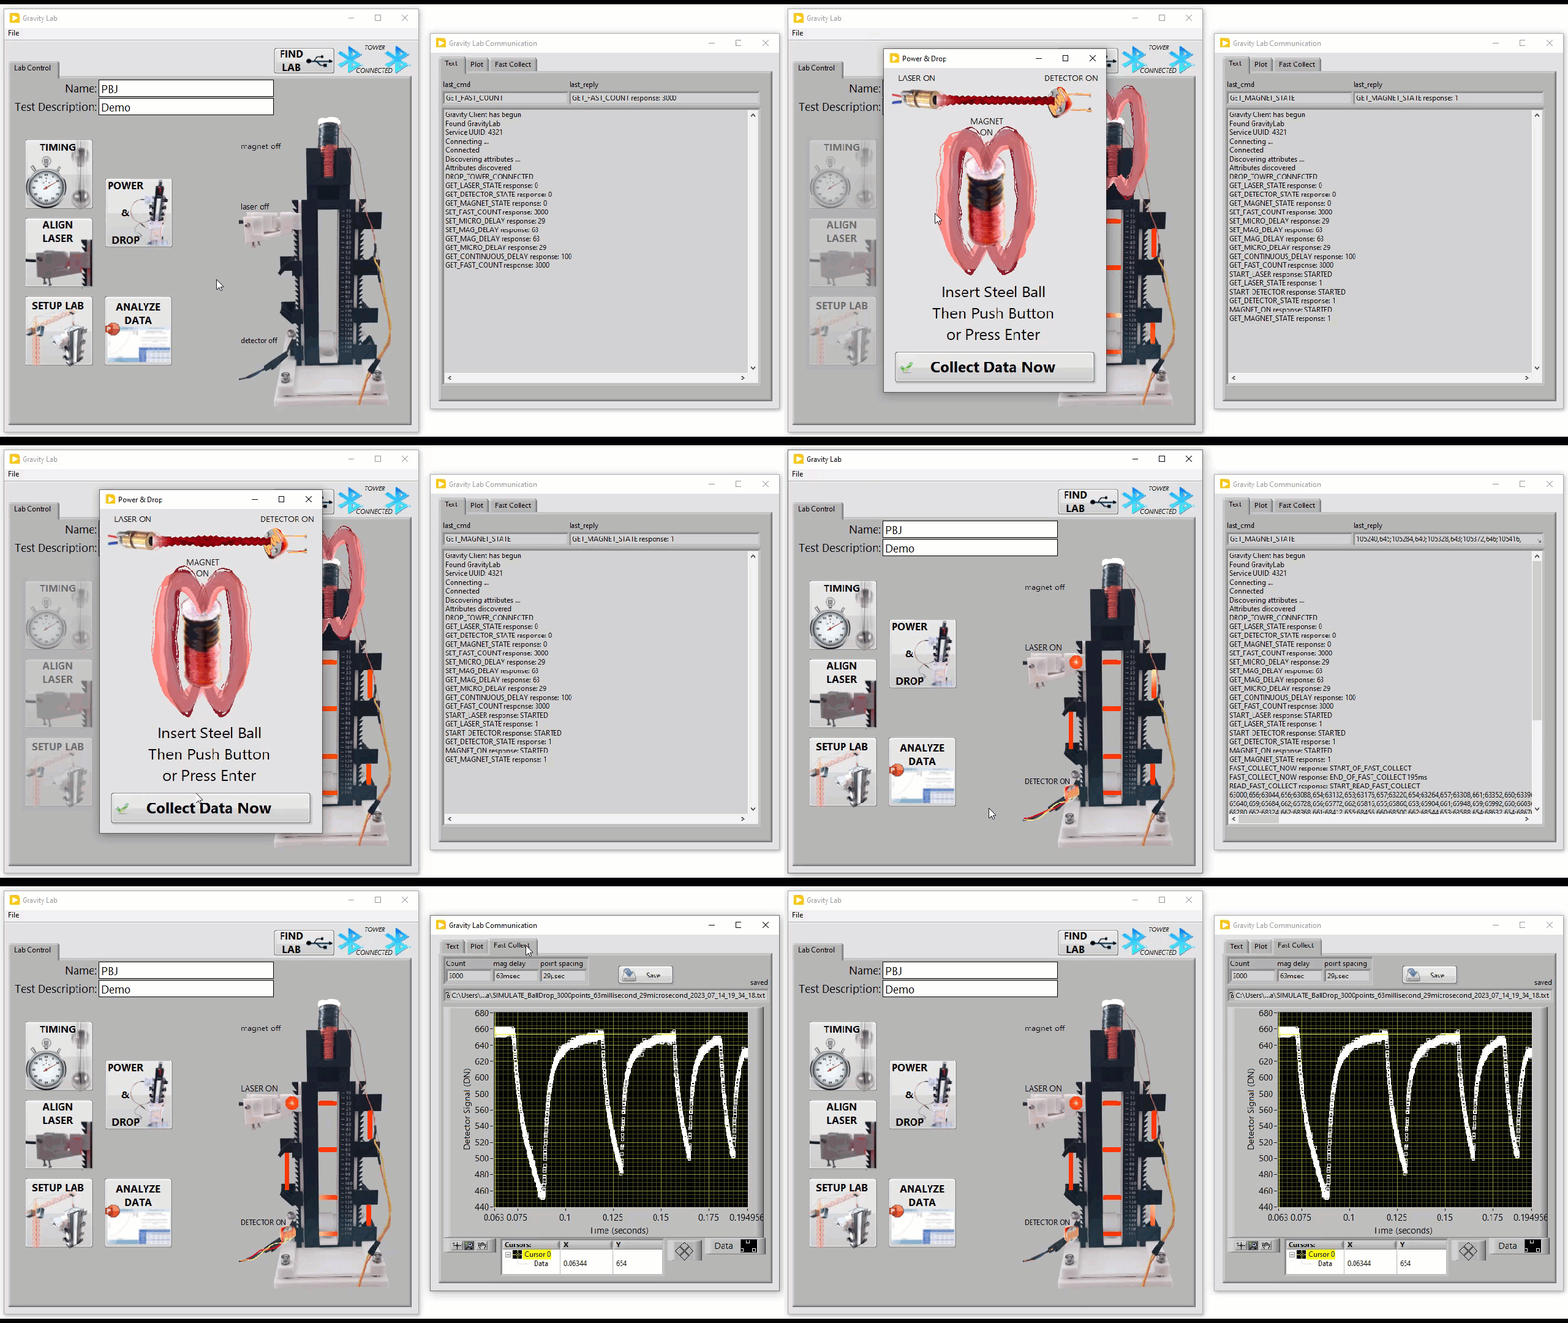
If you push the “Collect Data Now” button or press Enter, the magnet will turn off, the ball will drop and the data will be collected and saved as a text file. The “Gravity Lab Communication” window will show the file that is saved a plot of the raw data and display the text communication from the tower.
If you close the window with the X in the upper right corner the magnet will stay on but the window will close.
Analyze Data
Analyze Data
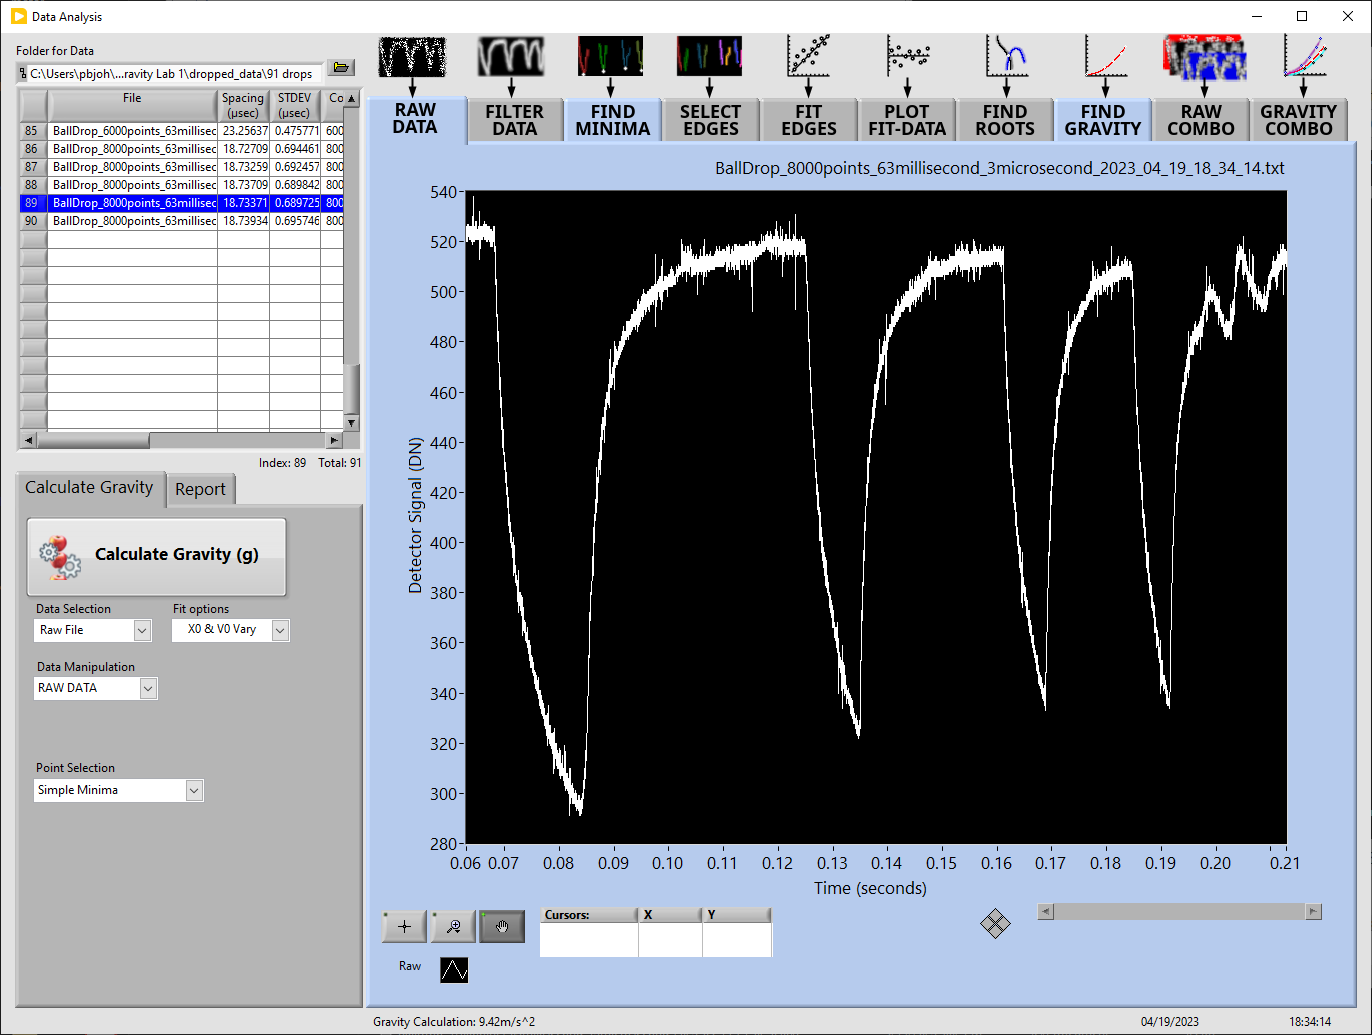
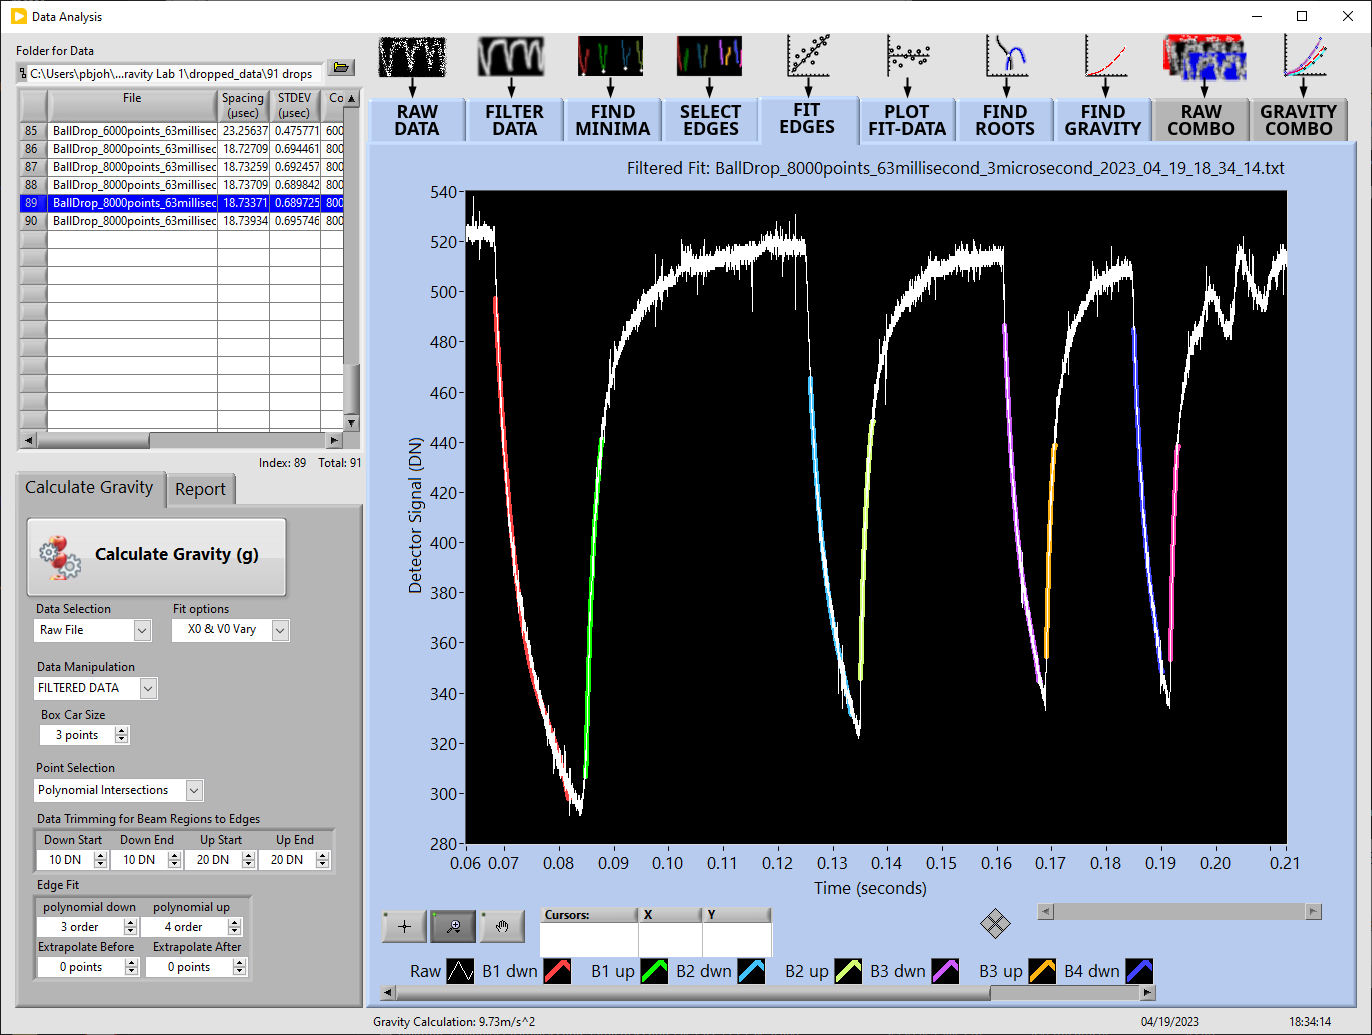
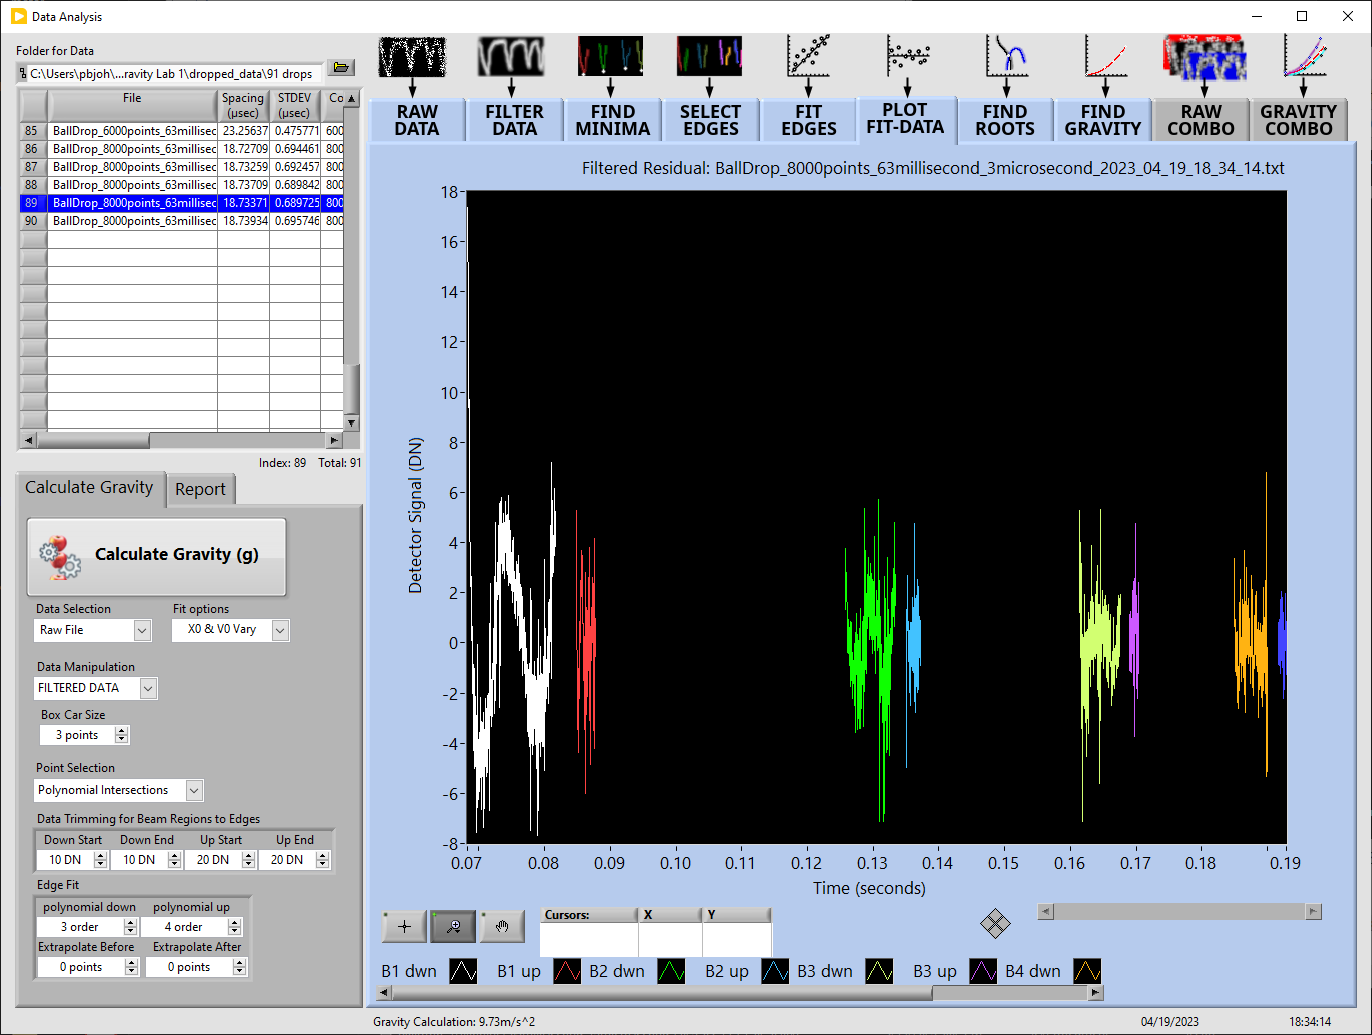
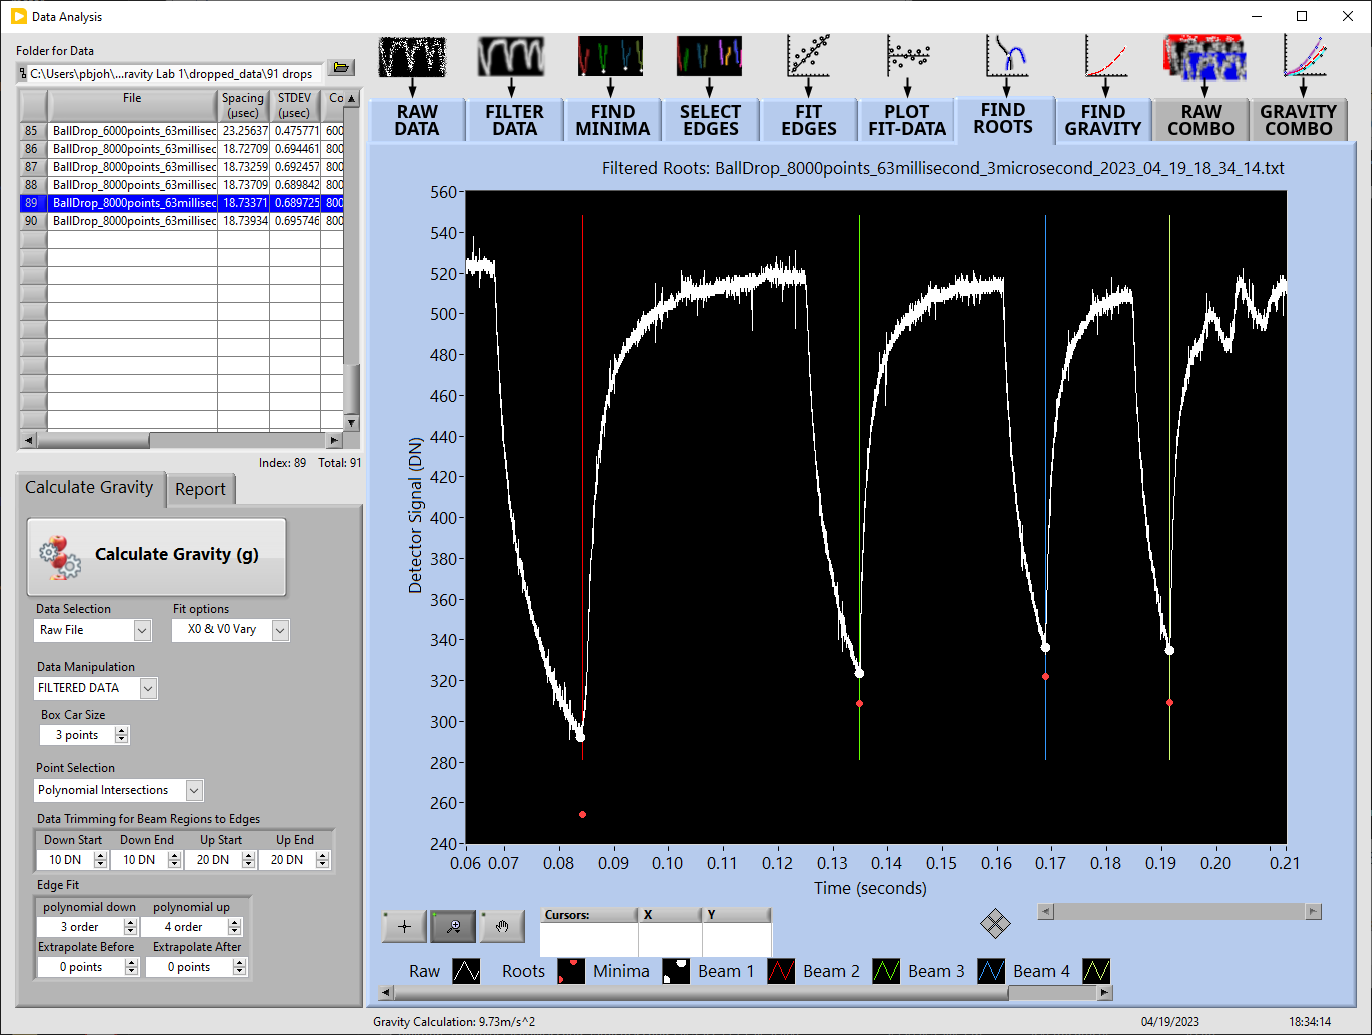
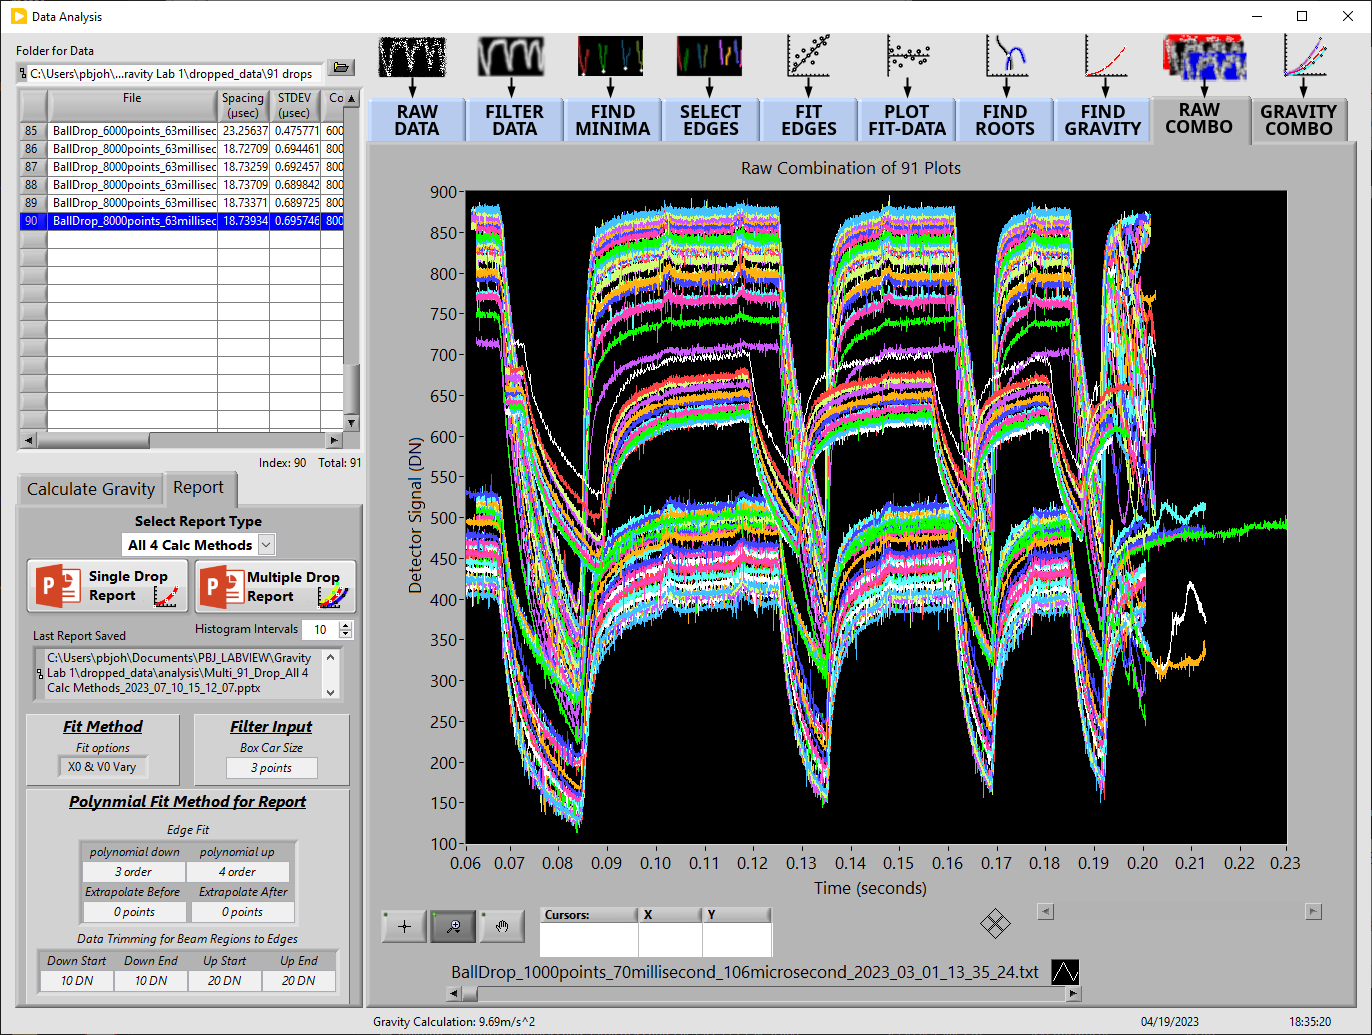
Push the “ANALYZE DATA” Button and the “Data Analysis” window will open. The current file collected will be plotted on the RAW DATA Tab, and the File name will be highlighted in the multi-column list-box below the “Folder for Data” control.

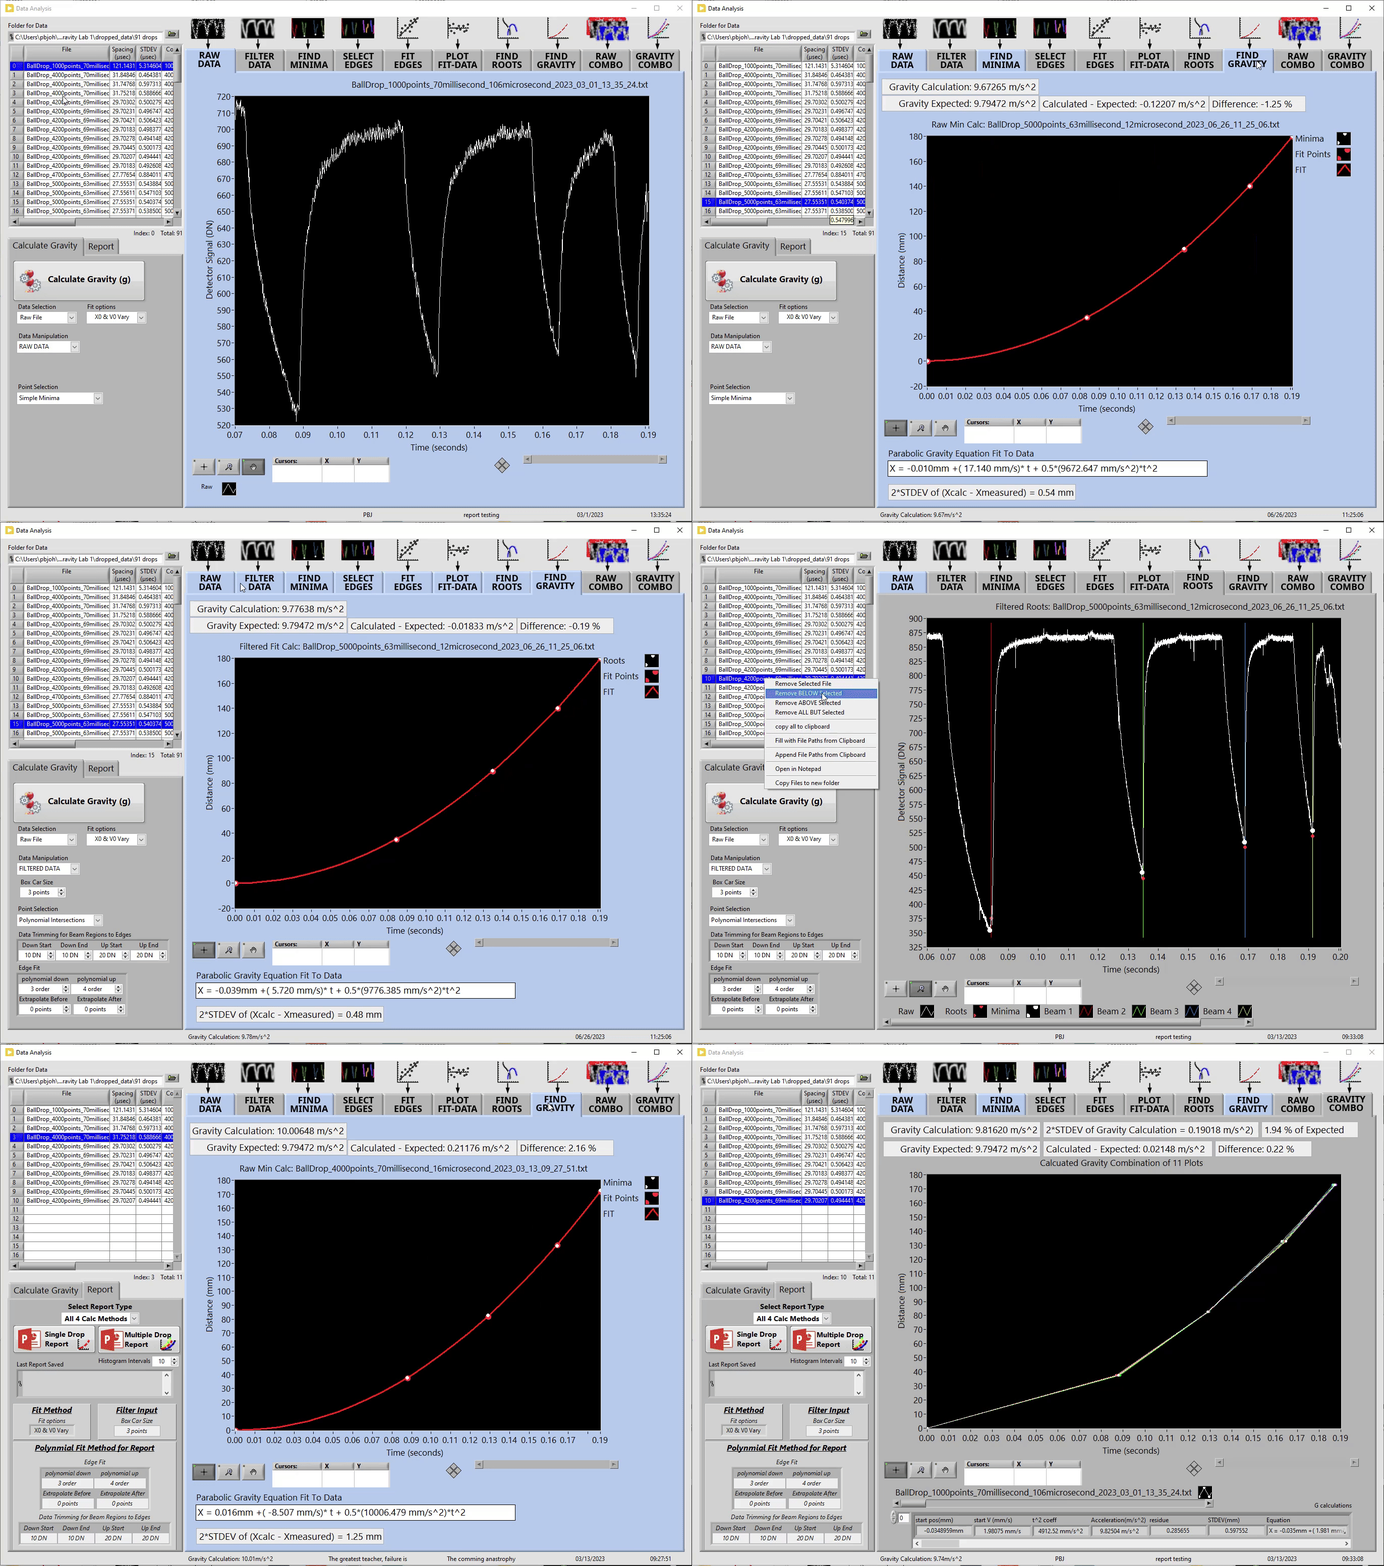

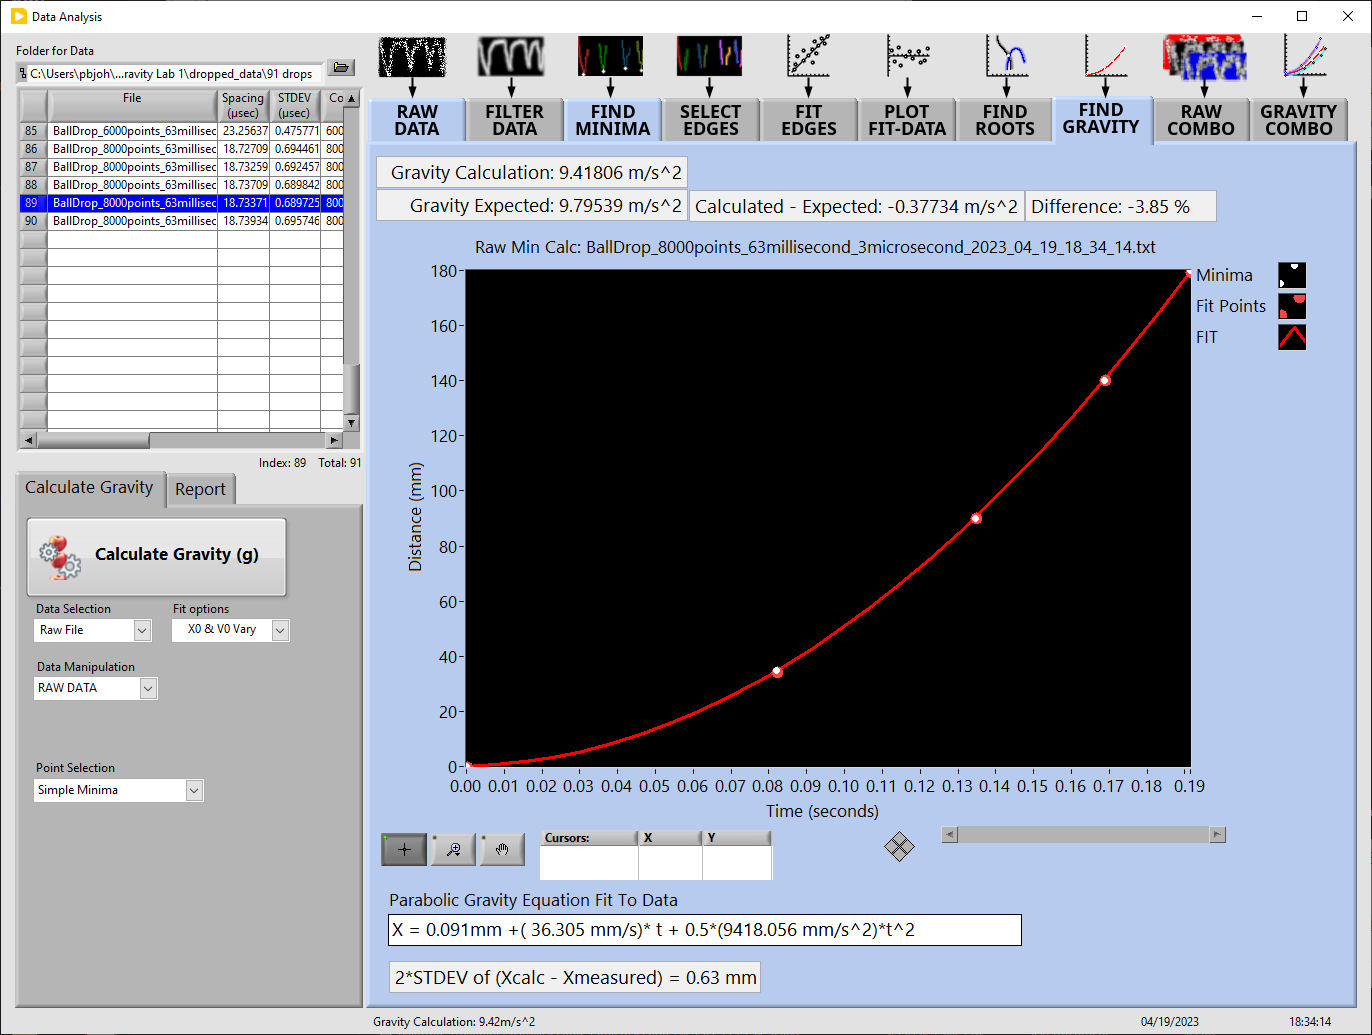
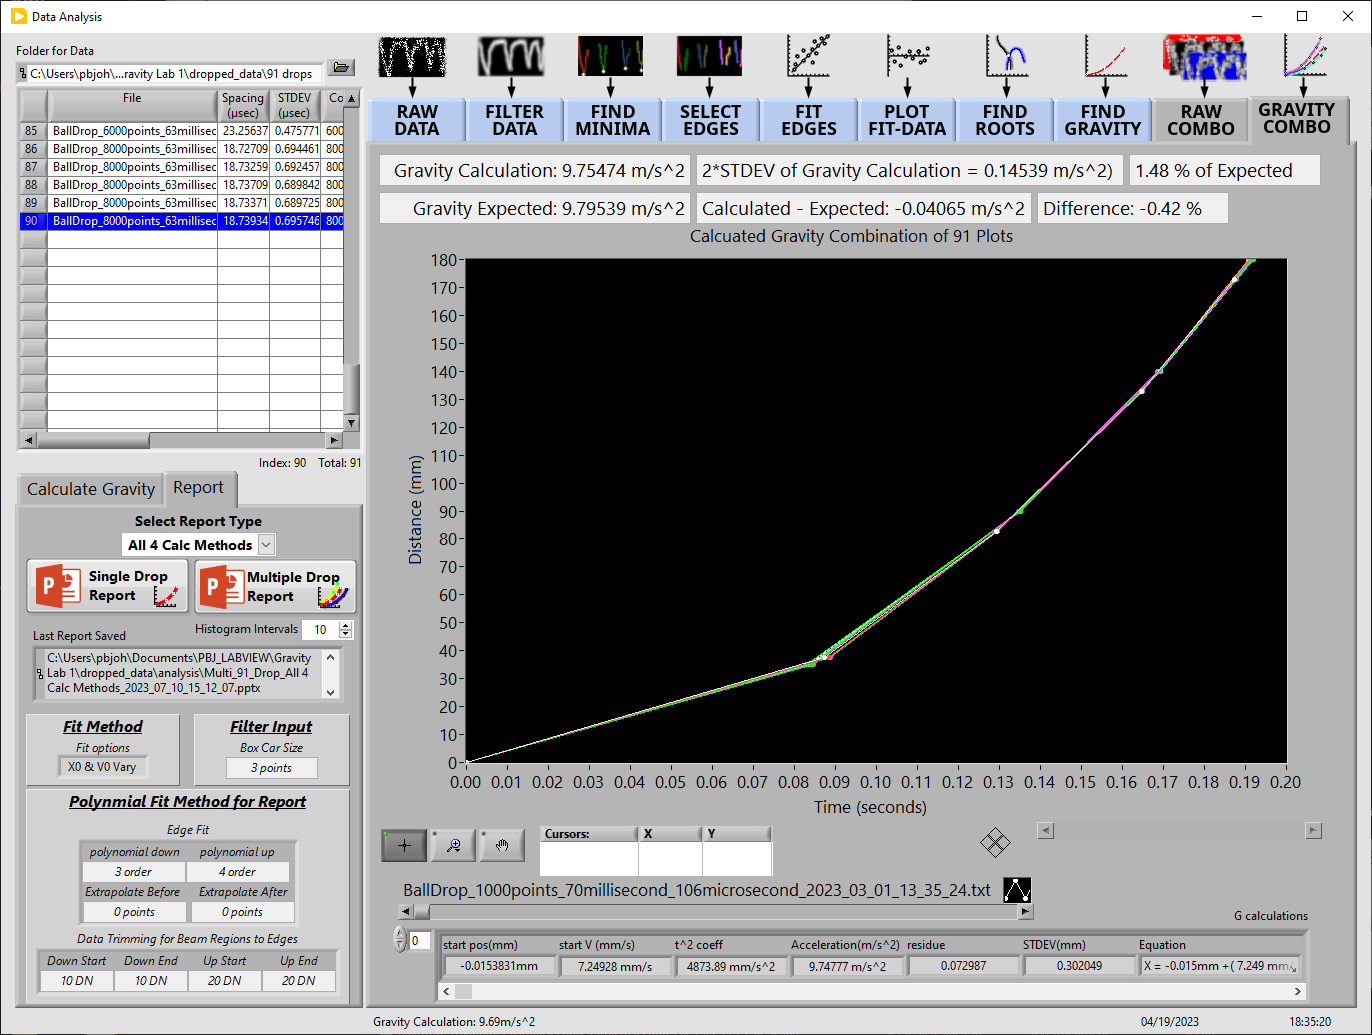
Push the “Calculate Gravity (g)” button and the gravity will be calculated for this data drop using a parabolic fit to the beam crossing points.
The gravity calculation is shown at the bottom of the “Data Analysis” window and on the FIND GRAVITY tab.
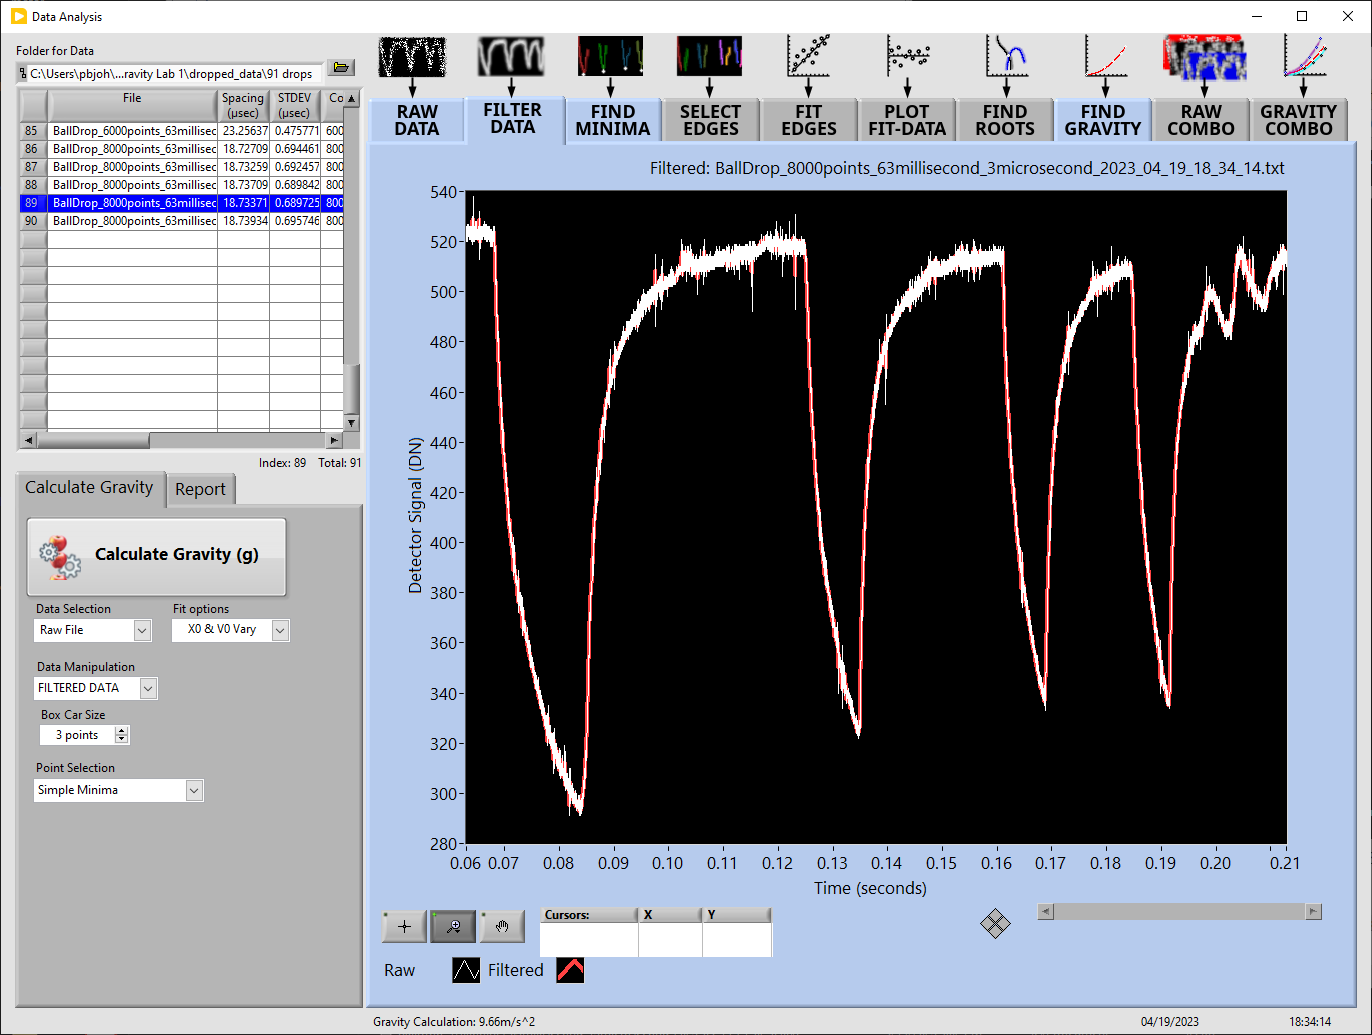
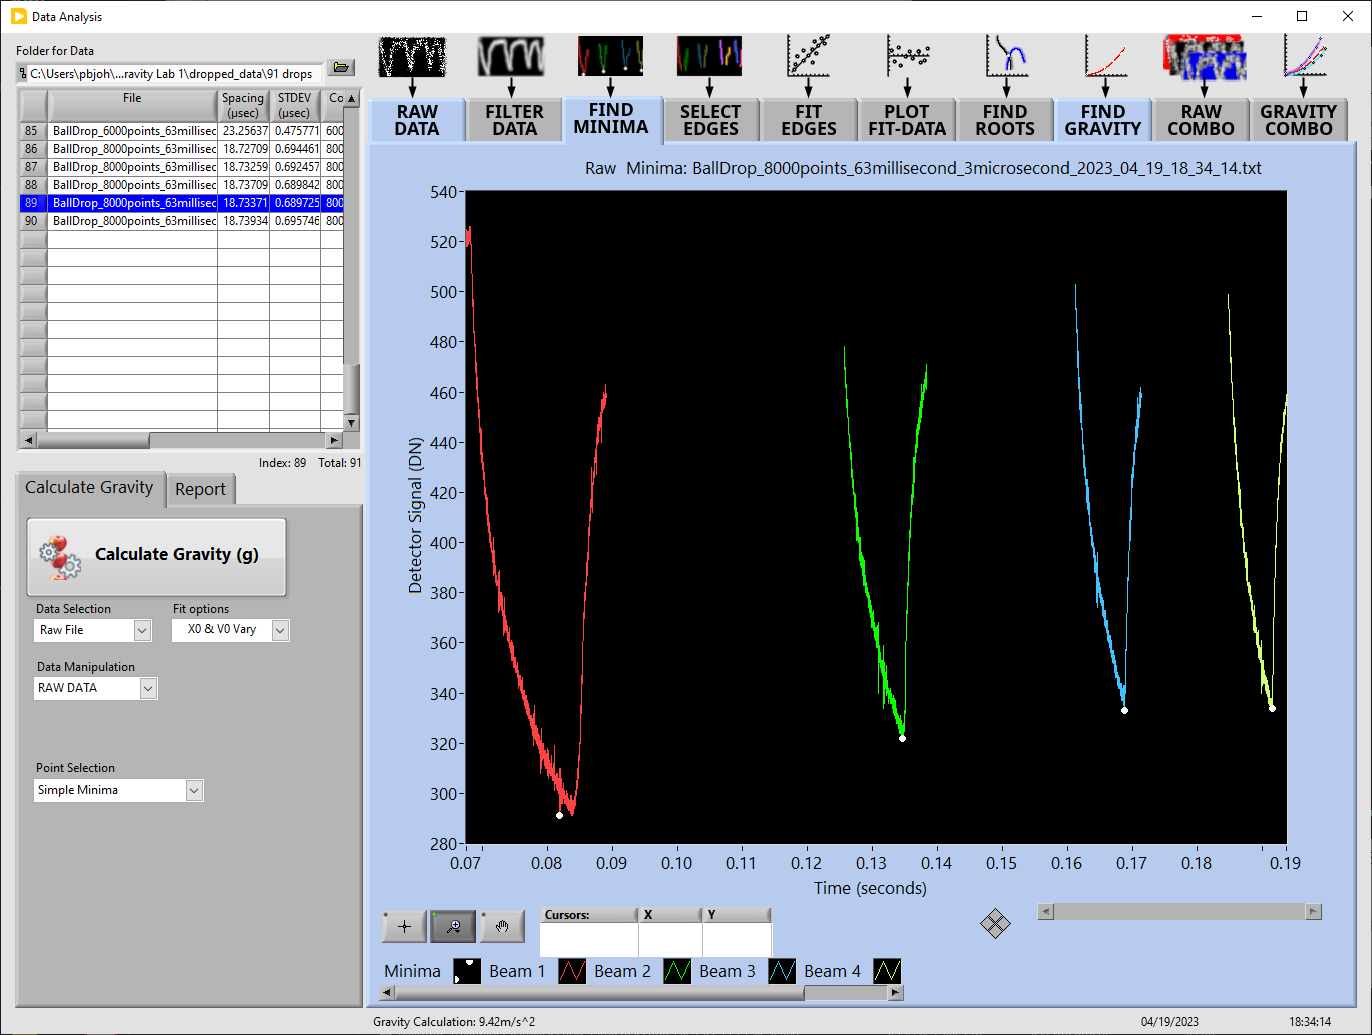
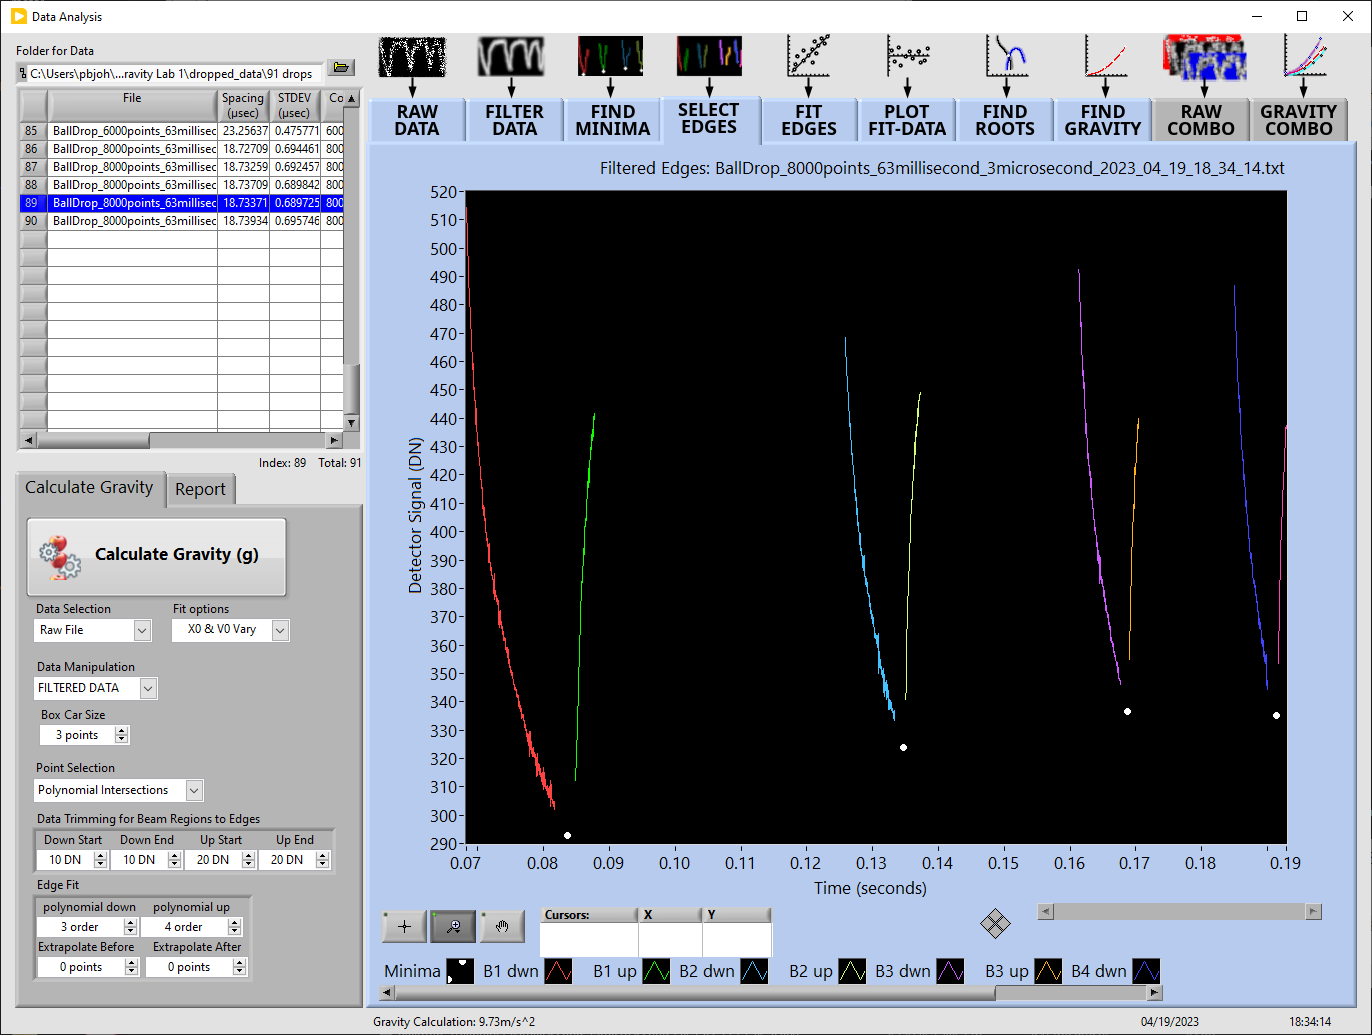
The process used to calculate the gravity is refined by 4 pull-down menus named “Data Selection”, “Fit options”, “Data Manipulation” and “Point selection”


Push the “Single Drop Report” button to create a power point report for the selected drop. The “Select Report Type” pull-down control determines how the gravity calculation is reported for the selected data.


Single Drop Report – All 4 Calc Methods (X0 & V0 Vary)
Single Drop Report – All 4 Calc Methods (V0 = 0)

Push the “Multiple Drop Report” button to create a power point report for all the data files found in the multi-column list-box above the control. The “Select Report Type” pull-down control determines the gravity calculation method for every data file used. The “Histogram Intervals” control determines the number of bins to be used for histogram plots in the report.
![]()
Multiple Drop Report – All 4 Calc Methods (X0 & V0 Vary)
Multiple Drop Report – All 4 Calc Methods (V0 = 0)
